Octavo
The quantitative social science starter pack
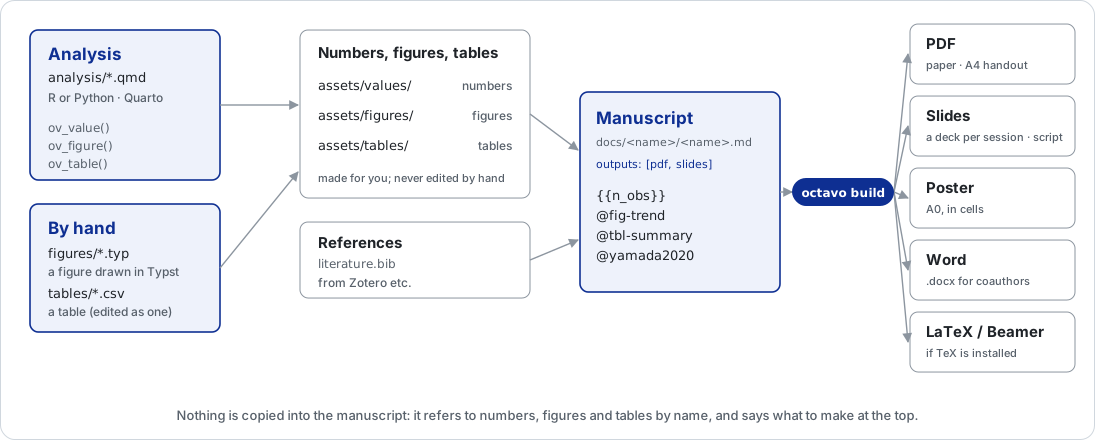
Write your papers, slides, lecture notes and posters in Markdown, keep the
analysis in Quarto, and let Octavo place the analysis's numbers, figures and tables in every
document — then typeset them to PDF (with Typst) and Word, or LaTeX if you have TeX.
Each manuscript says at its top what it makes. Citations come from one .bib
file, in any CSL style.
How it works
What you get
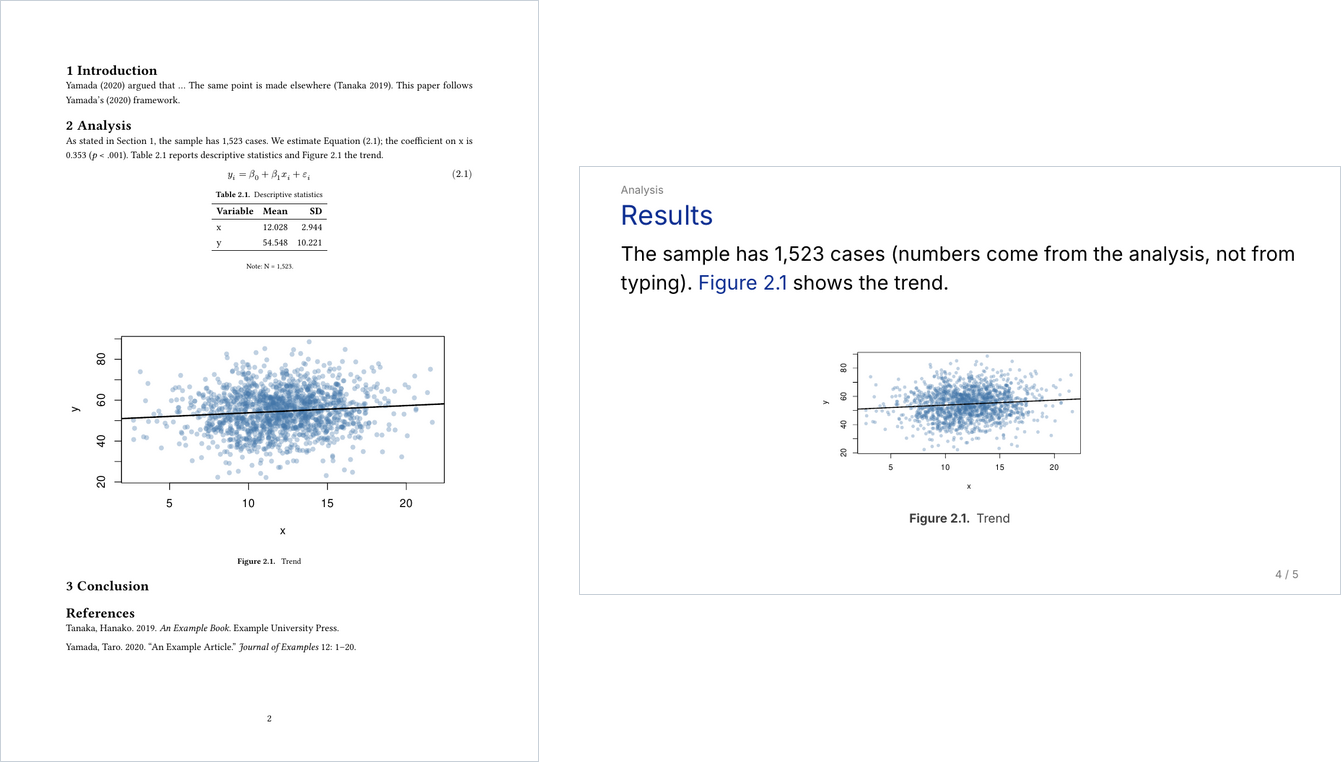
octavo init demo --all --example). The coefficient, the table and the
figure come from the analysis; the numbering and the references are filled in when
it is typeset.What it does
No number typed by hand
The analysis registers a value (ov_value("n_obs", nrow(d))) and the
manuscript calls it by name ({{n_obs}}). Re-run the analysis and every
document follows.
R or Python
The analysis is a Quarto .qmd in R or in Python, with the same helpers
in both, and the project's .venv and renv set up for you.
One manuscript, the outputs you choose
outputs: [pdf, slides] at the top: a paper in your journal's layout, an
A4 handout, a slide deck per session (keeping the handout's numbers, or only the parts
you mark), a speaker script, an A0 poster, and Word for coauthors.
References by label
@fig-trend becomes “Figure 2.1”, and stays right when you reorder
sections.
Checked before you submit
octavo check finds numbers typed into the prose, placeholder values,
missing citations and figures, and word limits exceeded.
Submission and beyond
Blind review, a submission zip, a coauthor's tracked changes in Word, what moved since you submitted, and a replication package.
A VS Code extension
A live PDF preview beside the manuscript that follows the cursor, a sidebar for all of the above, and one-click setup. Linux, macOS and Windows; English and Japanese.
Ready for your AI assistant
Every project keeps its working rules in AGENTS.md — never type a result
into the manuscript, and so on — which Claude Code, GitHub Copilot, Codex and Antigravity
all read, so the assistant knows them from the start.
Install
With VS Code, install the
Octavo extension
and press Set up when it asks: it installs pandoc, Typst, Quarto, R,
the fonts and the octavo command.
From a terminal:
curl -LsSf https://astral.sh/uv/install.sh | sh
uv tool install octavo-kit
octavo setup     # pandoc / Typst / Quarto / fonts / R
octavo doctor # reports anything still missingGetting started
With VS Code: open a folder and the Octavo icon in the activity bar. In a folder that is not a project yet it offers New project — choose the parts you need (an analysis in R or Python, a paper, slides, lecture notes, a poster) and whether to fill them with examples. Then open a manuscript and press the PDF button at the top right of the editor: the PDF appears beside it and follows your cursor.
From a terminal, try the example first — an analysis, a paper, slides, lecture notes and a poster:
octavo init demo --all --example
cd demo
octavo env       # the analysis environment (.venv and renv)
octavo build --compile
Then your own project, with just the parts you need:
octavo init study --with analysis,paper
cd study
octavo env       # the analysis environment (.venv and renv)
octavo build paper --compile
octavo check     # before you submit
Diagrams without TikZ
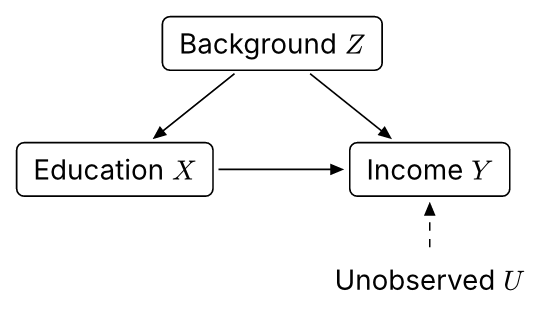
Boxes and arrows, a causal graph, a flow: draw it in Typst, in a file of its own.
octavo new figure dag writes figures/dag.typ with a small
diagram() helper (no packages), and octavo build turns it into a
figure like any other — in every format, numbered, and referred to by label.
#diagram(
  (z: (2, 0, [Background $Z$]),
   x: (0, 1.6, [Education $X$]),
   y: (4, 1.6, [Income $Y$]),
   u: (4, 3, [Unobserved $U$], (stroke: none))),
  (("z", "x"), ("z", "y"), ("x", "y"),
   ("u", "y", (dash: "dashed"))),
)
Posters
A conference poster from the same project: octavo new poster writes a
manuscript whose top-level headings are the cells, in a 2×3 grid on A0 by default. Join
cells with {span=2} or {rows=2}, change the paper and the grid at
the top, and put logos and a QR code in the title band. A cell whose text does not fit is
reported when you build. A poster can also be made from a paper, from the parts you mark.
---
title: Counting how policy is made
author: [Author One, Author Two]
event: Example Conference 2026
qr: https://example.org/paper
outputs: [poster]
poster_rows: [1, 2, 1]
---

# Question

# Data and methods

# Results {span=2}

# Conclusion

# References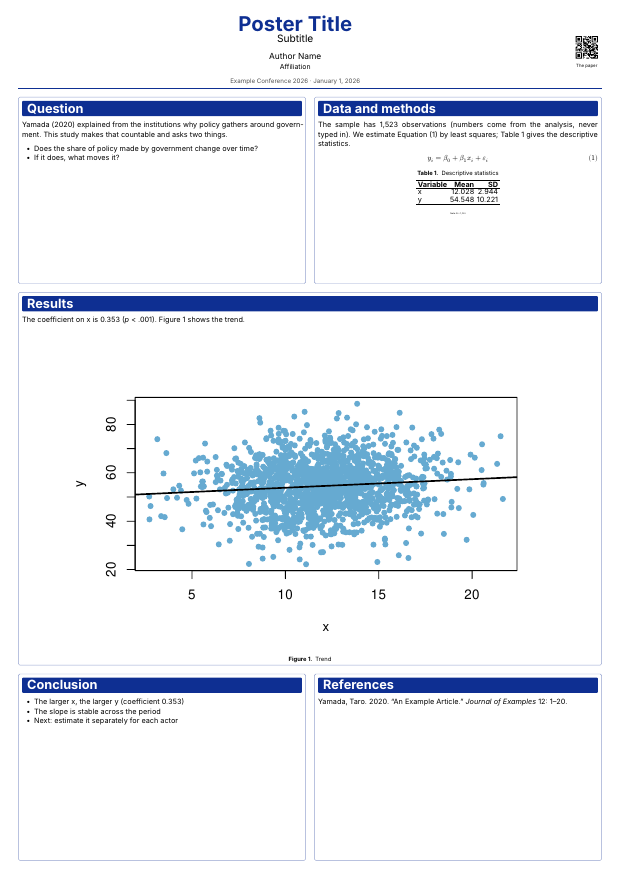
octavo init demo --with analysis,poster --example).Documentation
The guide covers everything. Lecture notes have a page of their own, Making lecture notes: the steps in VS Code and a quick reference to the marks.
- Install — Linux, macOS and Windows, step by step
- Your first project —
octavo initandoctavo new, the analysis environment - Writing manuscripts — references, numbered blocks, math, figures, tables
- The analysis — numbers, figures and tables from Quarto
- Citations
- Papers — checking, blind review, submitting, revisions
- Slides, lecture notes and posters — sessions, per-session handouts, posters
- Making it yours — templates, Word styles, fonts
- Command reference
- VS Code
- What to check on your own machine